Build Dynamic Text
Dynamic Text enables users to build data-driven text that can then be added to presentations.
users the ability to create data-driven infographics. These infrographics can then be added to presentations and reports, where they can be configured to use data interactions from other artifacts - grids, charts, slicers and variables - to create responsive graphical displays of information that are more intuitive to understanding the underlying analysis, and are interactive for the end user.
Dynamic PQL Functions
- Click here to read about how to configure dynamic PQL functions in Illustrate
- Click here to review the dynamic PQL functions in Illustrate
Example: Build Dynamic Text
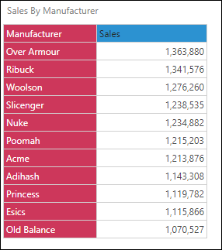
In this example, the dynamic text will be driven by a grid listing sales by manufacturer, in descending order. The text should display the name of the top manufacturer, and its sales.
Step 1
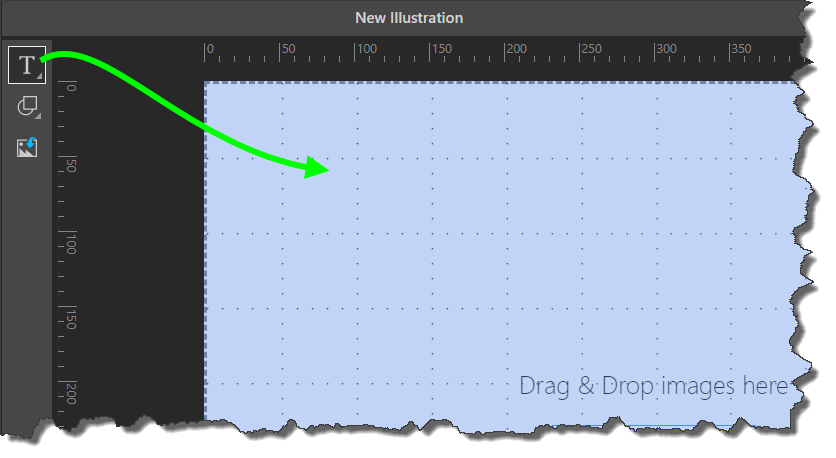
Add a textbox by clicking the Textbox button, and then clicking anywhere on the canvas:
Step 2
Write your text in the textbox. In this example, the text is 'Manufacturer sales were x'; both 'manufacturer' and 'x' will be made dynamic.
After entering the text, highlight the word 'manufacturer' and click the Dynamic Text button from the Component ribbon:

After clicking 'Dynamic Text', the Dynamic Text Function Editor will open; this is where you'll configure your dynamic text formula.

Step 3
Your dynamic text must be based on an existing grid. Open the Content tree drop-down and find the required grid; once selected, the grid will appear in the editor.
Create the dynamic text formula by selecting columns, rows, or cells from the columns, and applying functions to the selection from the Function trees (on the right).

STEP 4
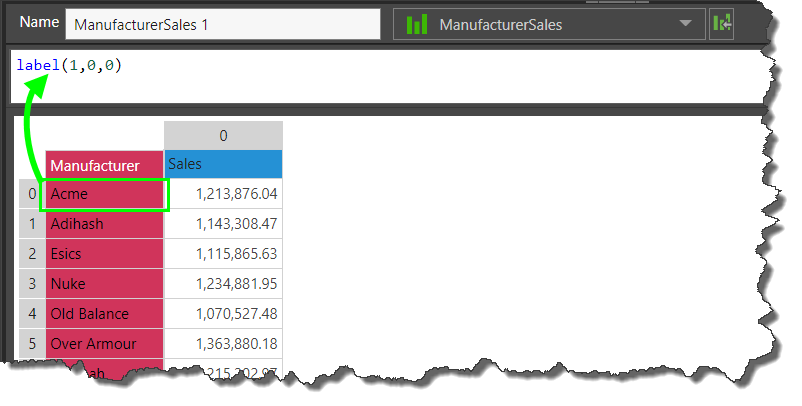
Click the cell that represents the value or element you want to add to your dynamic text.
In this example, this is the cell containing the 'Acme' header. Once the cell has been added in the next window, click the test button to verify your selection, or click Apply to confirm your selection and close the editor.
STEP 5
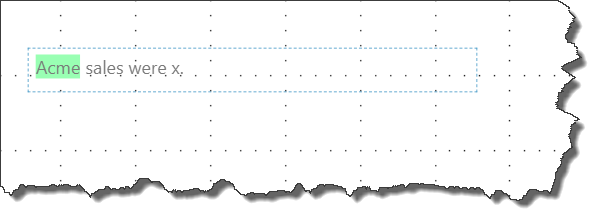
Once applied, the dynamic text will appear in your textbox.
If your statement contains multiple dynamic elements, repeat steps 2-5.
In this example, the corresponding sales value for the Acme must be added as a dynamic element, so highlight 'x' from the textbox and click Dynamic Text.
STEP 6
Find the same grid in the Content tree, and select the cell containing the sales for Acme:
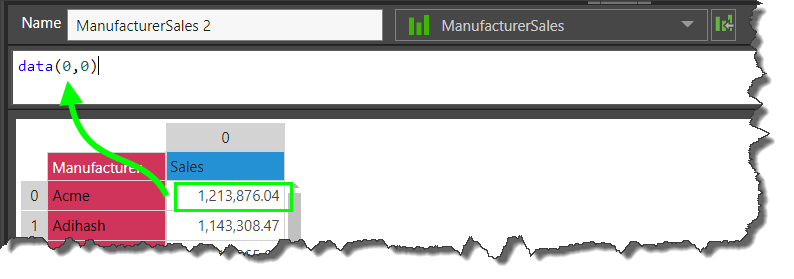
STEP 7
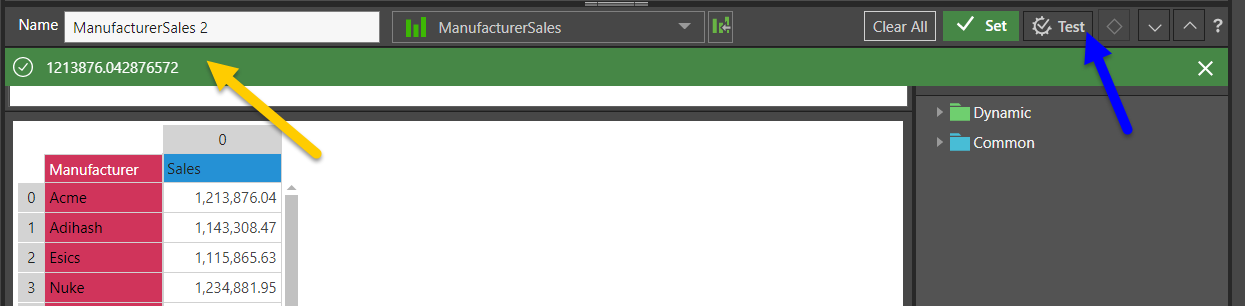
Test your selection (blue arrow).
If selecting numeric values, you can specify the format. In this example, the amount returned (orange arrow) contains too many decimal places. In order to change the formatting and reduce the number of decimal places, a dynamic function will be applied.
Highlight the data cell from the function editor (blue arrow), and open the Common functions tree and select 'CurrencyDollars0' (green highlights) to change the formatting to dollars with no decimal places.
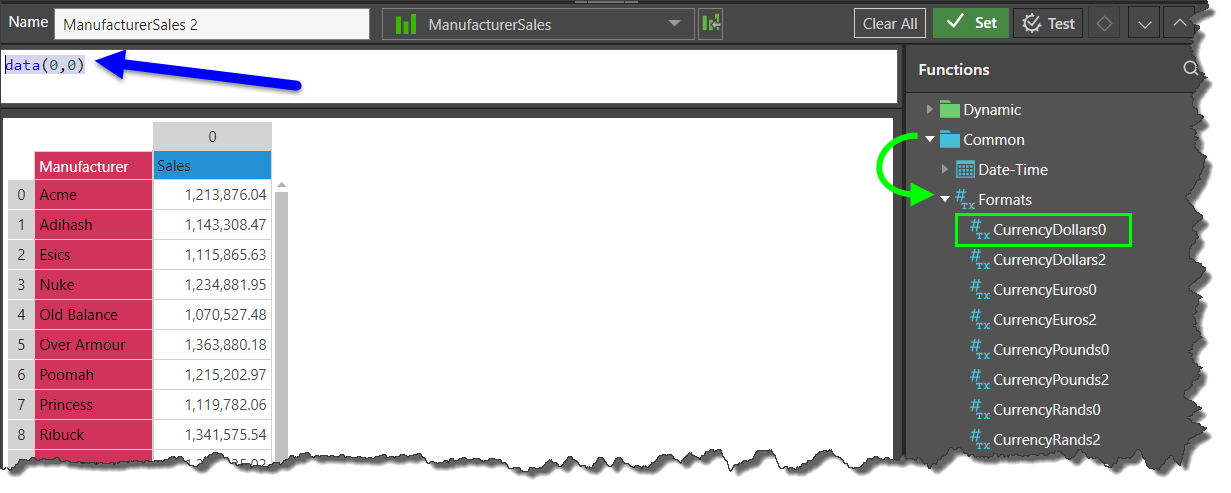

Now test the function to see a preview, and then click Apply to confirm the function:

STEP 8
Your dynamic text is displayed in the textbox; save your text for later use in the Present and Publish modules.
